
How much empty space is too much?
Of 383 available commercial properties in Carmel (0nly 217 were available in March 2019) over 20 are on Rangeline Rd. between 116th and 136th St. alone. That is more than 1 vacancy per block on Rangeline alone.
This during what many consider the best economy in our countries history.
Overall there are 78% more vacant spaces than in March of 2019
(see link at bottom of the page for March 2019 numbers)
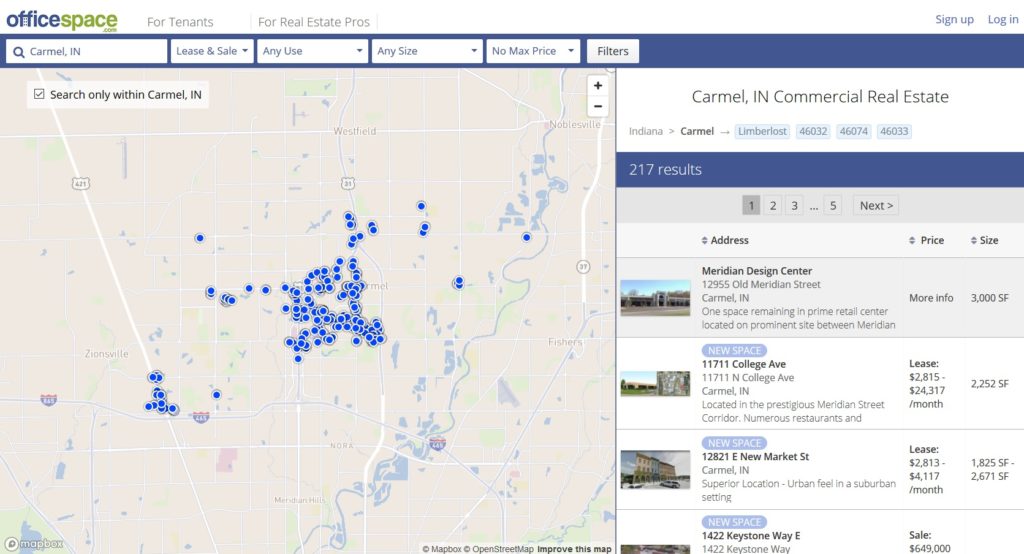
Carmel has 383 commercial real estate spaces for lease, representing 2,355,768 sqft space. 63 buildings are available for sale.
In the past 30 days, (Jan 2, 2020) Carmel has had 4 spaces leased and 14 new spaces come on market.
https://www.officespace.com/in/carmel
So how fragile is Carmel’s economy?
Consider that Carmel leased 4 properties and had 14 new properties come on the market in the month of December 2019. This means there was a net increase of 10 new spaces or a 2.6% increase in 30 days.
So to answer how fragile Carmel’s economy is we must consider how much new space is under construction and coming onto the market in the next 6 – 12 months.
A similar increase of 2.6% monthly would yield an additional 31% of new empty commercial space in just one year.
How about it Henry Mestetsky? Would you start reporting monthly during your City Council briefing on Carmel vacancy and occupancy numbers, average days inventory of Commercial by segment. (Multi-family, Office, and Retail)
Additionally, if you could please report new projects in the funnel and those that are currently under construction with the number of new projects and total space that make up these works in progress.
Henry, if you can do those few things Carmel Citizens would at least have an awareness of the state of our local economy.
Missing teeth and more New Commercial and Apartment Space are coming fast! March 31, 2019 vacancy numbers.
What we are asking for?
In order to provide useful occupancy information the CRC really needs to break it down by segment on a monthly basis, quarterly at the very least. – Show the current occupancy levels, the change over the previous period, with a timeline showing projects under construction, SqFt of improved space under construction and the planned availability date of the project.
– It should be a split of all Vacancy and shown as both past, current and planned future occupancy data by the following segments.
1.) Multi-family
2.) Retail
3.) Commercial
– Knowing we had a 78% increase in vacant units between March 31, 2019, and January 2, 2020, is something Carmel citizens should have been aware of.
